 NATARAJA
AI Overtook Death in the World's Search Data. It Displaced Nothing.
By NATARAJA Team
Five years of attention data across 35 markets carry a warning for every leader who has ever acted on a share chart.
Idea in Brief
The claim. Track eight enduring human concerns (Death, Family, Money, Love, Health, Religion, Philosophy, and Artificial intelligence) as shares of one attention basket in Google search, across 35 markets over five years, and AI now holds the largest share in most of the world. It has crossed above the Death topic, historically the basket's most stable heavyweight, in 27 of 35 markets.
The reality. The crossover is an artefact of the ruler, not a shift in the underlying behaviour. Measured in its own level, the only quantity comparable over time, attention to the Death topic held or rose in 29 of 35 markets while AI surged. And an audit of what the Death topic actually contains found that in not one of the 35 markets do its visible queries show existential reflection leading. The metric being "overtaken" was obituaries, celebrity news, and funeral prayers.
The lesson. Three metric disciplines separate the finding from its misleading headline: never read a share change as a level change; audit what a composite metric contains before acting on it; and never treat a region as a single market. Each failure mode in this data has a direct analogue on an executive dashboard.
Imagine the slide your strategy team could bring you tomorrow. A clean five-year chart, a confident title: "AI has overtaken death as the world's dominant preoccupation." The data behind it would be real. The chart would be reproducible. And the conclusion would be wrong in three instructive ways, each of which has a counterpart in the metrics your own organisation runs on.
We built that chart deliberately. Under a pre-registered analysis plan and an adversarial internal review, we tracked an eight-topic basket of enduring human concerns through Google search data in 35 markets on six continents, from mid-2021 to mid-2026, validated every market against the platform's own reporting, and then audited what the headline metric actually measures. What follows is the finding, the three ways the obvious reading of it fails, and what each failure teaches about reading data at the top of an organisation.
The finding is real, and unevenly distributed
First, the part the imaginary slide gets right.
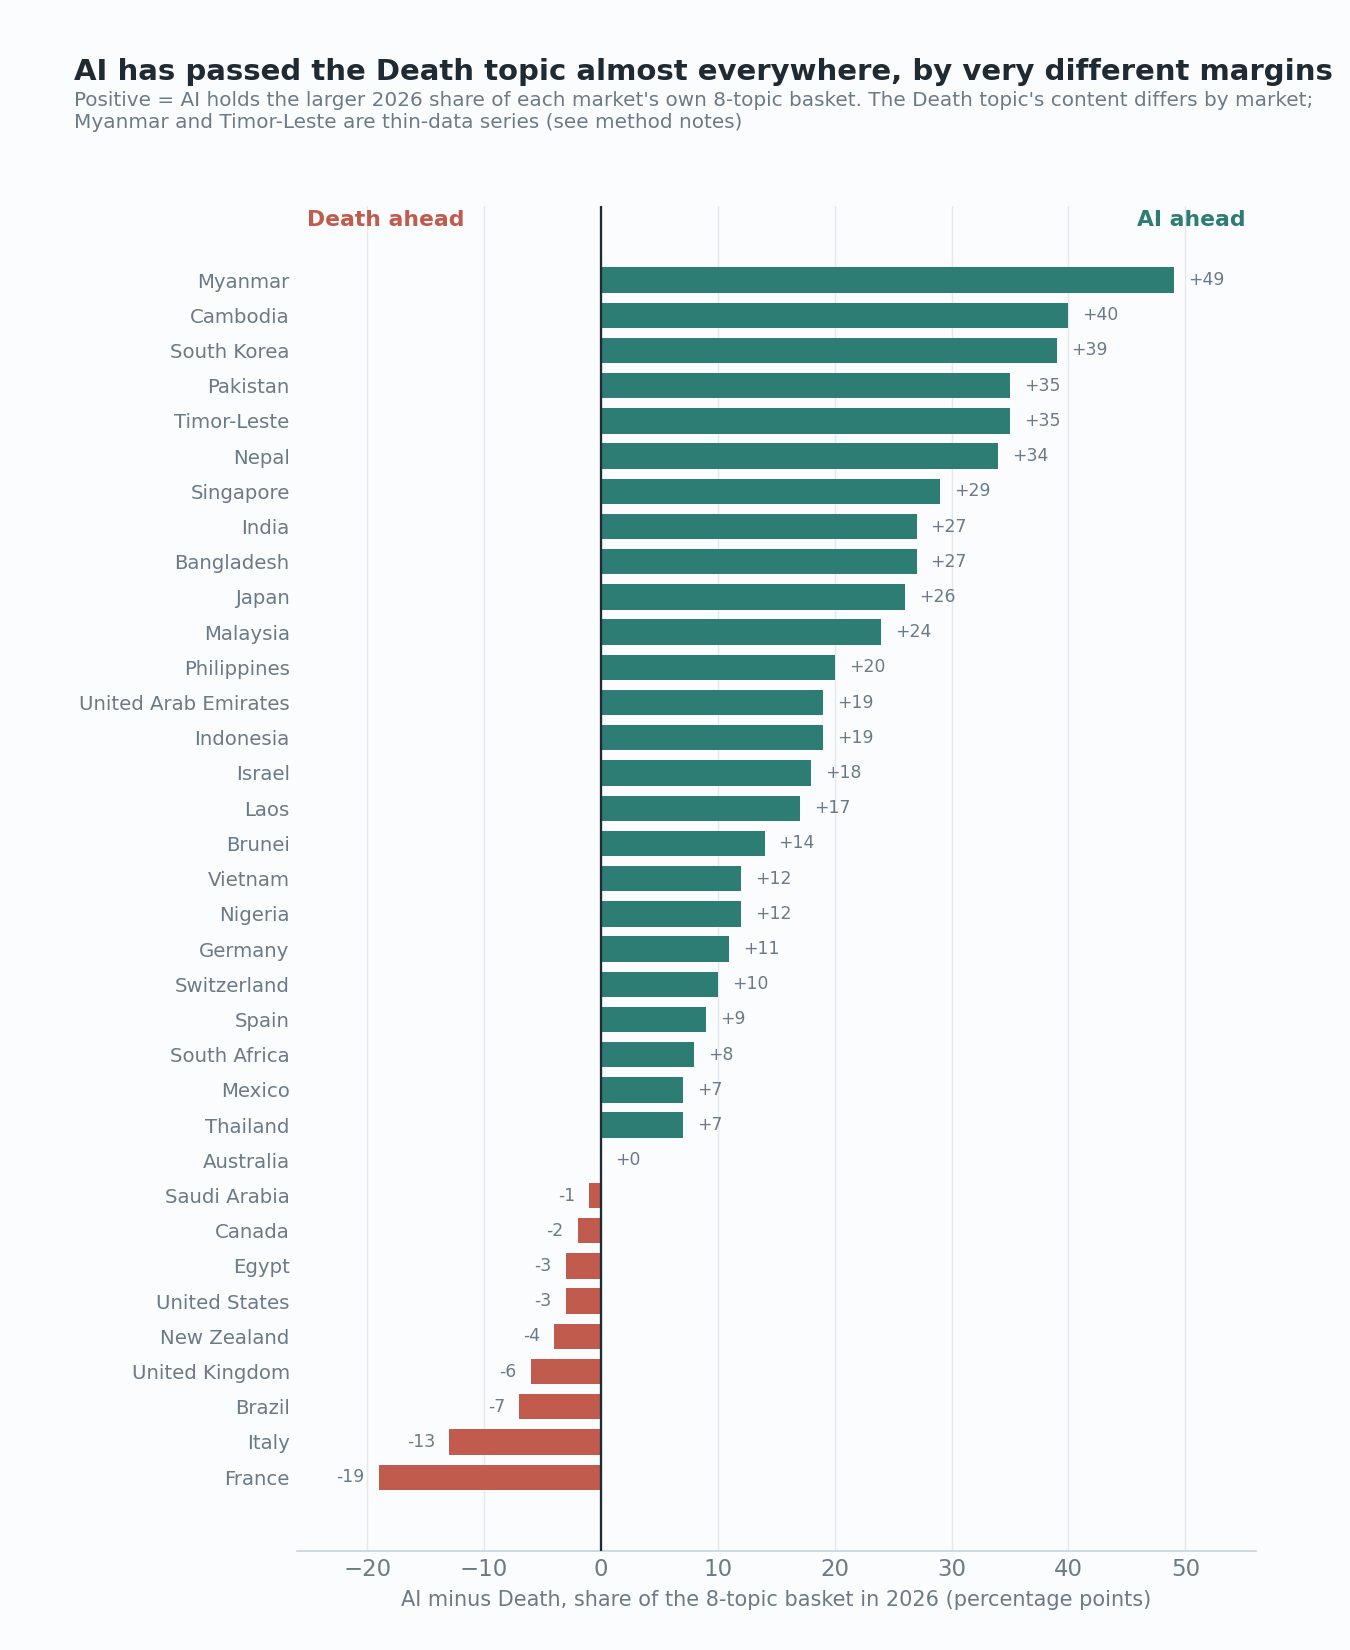
Rank the 35 markets by how far AI's 2026 share of the basket exceeds the Death topic's, and the spread is the widest number in the study: 68 percentage points, from Myanmar at +49 to France at -19. AI has crossed above the Death topic at some point in 27 of the 35 markets; in 25, its average 2026 share is now the larger of the two. The crossover swept developing Asia first and hardest: Cambodia, South Korea, Pakistan, and Nepal all show AI ahead by 34 points or more. At the other end sits a coherent set of hold-outs where the Death topic still leads: France, Italy, the UK, the US, Canada, New Zealand, Brazil, Egypt, and Saudi Arabia. Australia sits exactly on the line, with the two topics level.
Two cautions belong next to that chart, not in a footnote. The two most extreme positive readings, Myanmar and Timor-Leste, are the study's thinnest data series, though the pattern does not depend on them; the well-resolved markets beneath them tell the same story. And a large AI share is not a measure of AI enthusiasm or adoption. Share of a basket is relative twice over: it rises when interest in AI grows, but also when the other seven topics are small, and cross-country comparisons additionally inherit the quirks of Google's per-language topic classification. The chart licenses "AI dominates this basket in Myanmar". It does not license "Myanmar cares more about AI than France". Executives make the equivalent error whenever a product's share of a shrinking category is read as growth.
One more caution, and it governs everything that follows: the topic labelled "Death" in this data is not the contemplation of mortality. What it actually is turns out to be the study's most important result, and we will come to it. First, the arithmetic.
Failure one: the share trap
Here is the problem with the word "overtaken". Share is zero-sum by construction. When AI's slice of the basket grows, every other slice must shrink, by arithmetic, even if not a single person searched any less for anything. A falling share is compatible with rising, flat, or falling behaviour underneath. To find out which, you must leave shares entirely and measure each topic's own level within its market, the only quantity that can be compared honestly over time.
Do that, and the displacement story evaporates.
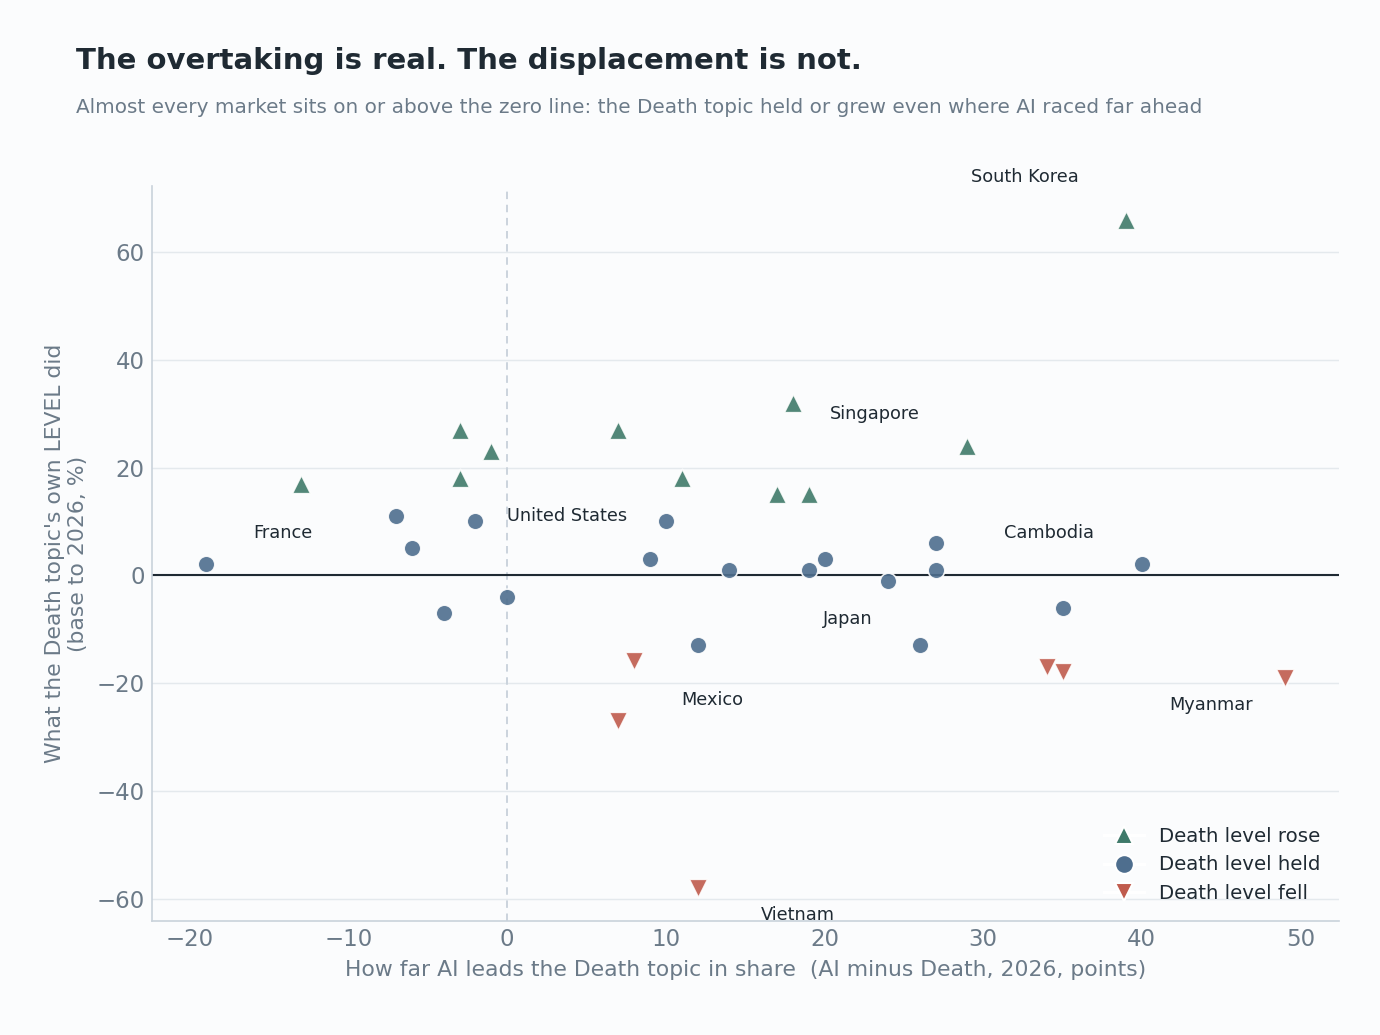
Plot every market by how far AI leads in share against what the Death topic's own level did, and the points pile up on or above the zero line. In 29 of 35 markets, the measured topic held its level or grew while AI raced past it in share. South Korea is the cleanest case: AI leads there by 39 points, and over the same five years the Death topic's level rose 66%. Nothing was consumed. Two lines climbed the same rescaled index at different speeds, and the faster one ended up on top.
Six markets do show the level falling: Timor-Leste, South Africa, Nepal, Vietnam, Myanmar, and Mexico. Each fails closer inspection. The week-to-week correlation between AI's movement and the Death topic's, which would need to be meaningfully positive for one to be pulling the other down, is close to zero in five of the six. Two are thin-data series. Vietnam's dramatic fall is contaminated by a homonym: its Death topic absorbs "di", the everyday Vietnamese word for "go". The verdict across the whole panel is the deflationary one the study pre-registered as its expected null: crossover in visibility almost everywhere, displacement in substance nowhere that survives scrutiny.
The dashboard translation is direct. Share metrics answer "who is bigger in this frame". They never answer "who grew". Any organisation that celebrates or panics over share movements without checking the levels underneath is reading this chart's mistake off its own screens.
Failure two: nobody audited the metric
Now the result that dismantles the premise rather than the arithmetic. "Death" in this data is a label assigned by Google's classifier to a bundle of queries. Before drawing a single conclusion about mortality, we read those queries, roughly the top 50 and rising 50 in every one of the 35 markets, and classified what the topic actually contains.
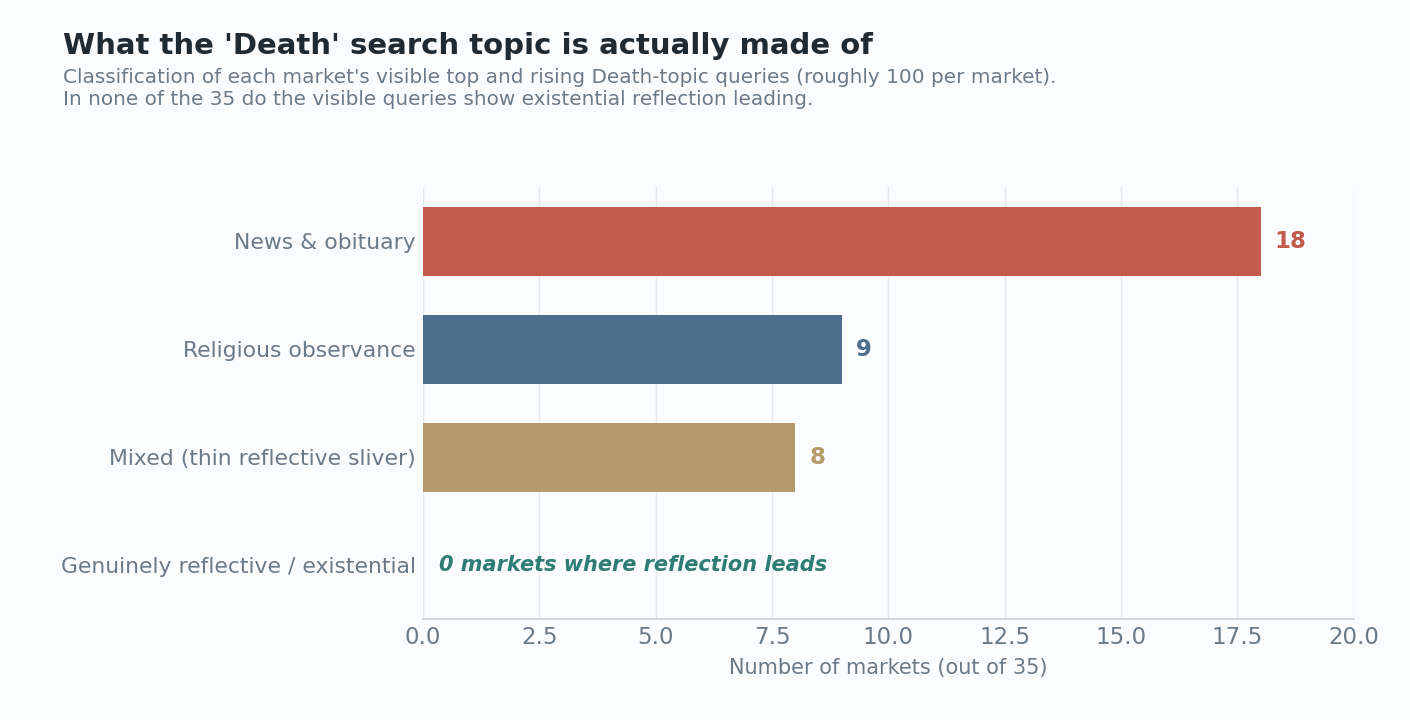
In 18 markets, the topic is dominated by news and obituary: celebrity deaths, disaster tolls, and the quietly enormous business of looking up death notices. France is the sharpest case. It is the most Death-dominant market in the entire panel, and its Death topic is overwhelmingly "avis de décès", regional death-notice and civil-registry lookups. The most death-anchored country in the data is mostly reading the obituaries. Japan's topic runs on anime and manga character deaths alongside celebrity news. Germany's carries a national true-crime genre of "missing person found dead". In nine further markets the topic is religious observance, led by Islamic funeral prayers and supplications across Egypt, Saudi Arabia, and much of Southeast Asia: real attention, devotional in character. The remaining eight are mixed, with reflection appearing only as a thin strand, a Buddhist query in Nepal, Urdu death poetry in Pakistan, never leading.
The count that matters is the zero. In none of the 35 markets do the visible queries show existential reflection leading the topic. Within the limits of the method, and it is a bounded method, reading sampled query lists cannot exclude reflective volume hiding in the tail, the construct the headline assumed simply is not there. What AI "overtook" was obituary lookup, mourning, and prayer.
This is construct validity, the least glamorous and most consequential property of any metric. One KPI name, 35 different phenomena underneath it. Every composite number an executive consumes, engagement, satisfaction, pipeline health, risk exposure, has the same structure: a label, a classifier or a formula, and an unexamined bundle underneath. The question this study forces is one worth asking of any metric that drives capital allocation: has anyone, ever, read what is actually inside it? It is the same discipline that data governance for agentic AI demands of the inputs behind an autonomous decision, applied to the numbers behind a human one.
Failure three: the substitution that never came
A subtler version of the displacement story survives the first two failures: perhaps AI is not displacing the Death topic but replacing our answers to it, crowding out Religion and Philosophy, the traditional consolations. The hypothesis is testable, and the data decline it.
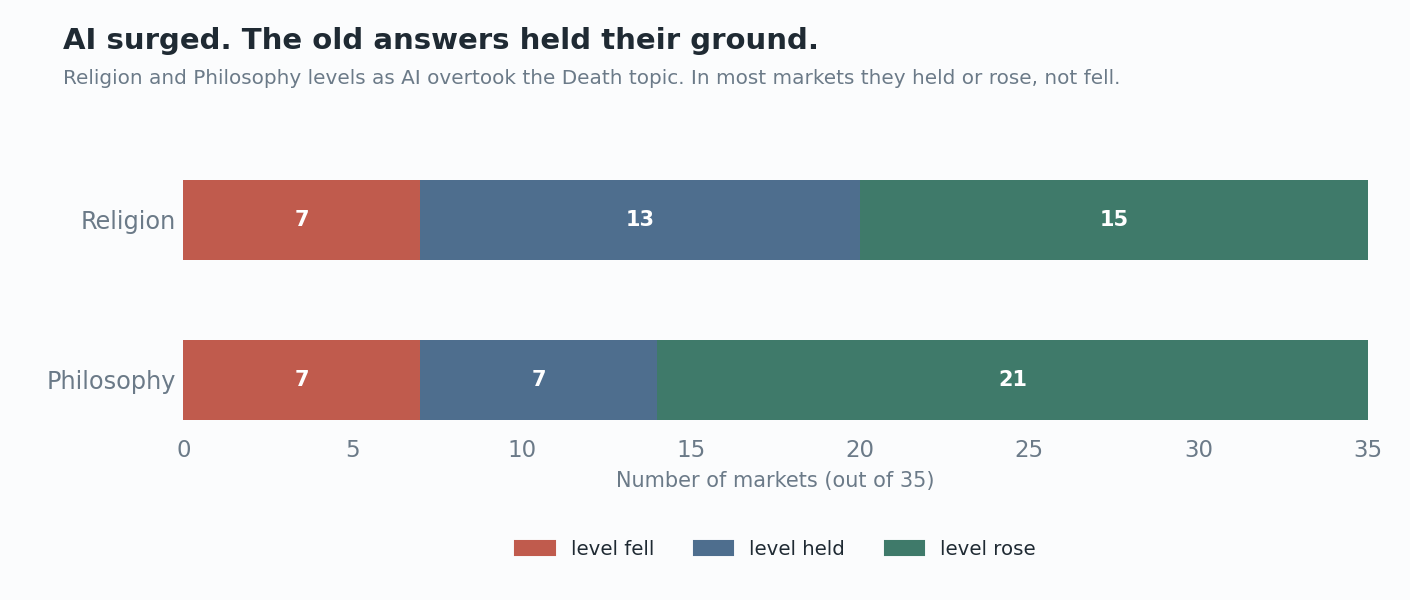
Two results close the question. First, Religion and Philosophy were never in charge: in none of the 35 markets do they lead the attention portfolio. There was no philosophy-led budget for AI to invade. Second, they did not yield ground anyway. Measured in levels as AI surged, Religion held or rose in 28 of 35 markets, Philosophy in 28 of 35, and both together in 24. The incumbents kept their altitude while the new entrant rose past everyone.
For leaders raised on disruption narratives, the pattern is worth a pause. Attention, like customer spend, is not a fixed pie that a new category must carve out of existing ones. AI's arrival in this basket was additive: it expanded alongside the incumbents rather than through them. The reflexive assumption that every fast riser must be draining an identifiable victim is exactly that, an assumption, and here it fails 29 times out of 35.
Failure four: regions are not strategies
The study was built around a Southeast Asian lens, with three focus markets chosen to differ on religion, income, and technology: Thailand, Singapore, and Indonesia. Any regional strategy implicitly bets that such markets share a signature. These three do not, and the dispersion is itself the finding.
Thailand behaves like a Western benchmark: the smallest AI lead of the three, a mere 7 points, over a Death topic whose level grew 27%. Singapore is one of only seven markets on Earth where AI is the single largest topic across the full five years, yet its Death topic rose in level underneath. Indonesia is the only one of the three where both Religion and Philosophy fell as AI rose, and its Death topic is Islamic observance and dream-interpretation. Against the wider panel, Thailand resembles Britain more than neighbouring Cambodia; Singapore sits with Korea and the Gulf; Indonesia patterns with Egypt. Any plan that begins "in Southeast Asia, consumers..." has already made an error this data can measure.
What to take back to your own dashboards
The study set out to answer a cultural question and ended up documenting, with unusual cleanliness, four failures every executive metric is heir to.
- Separate share from level before you react. Share answers "who is bigger in the frame"; only levels answer "what actually changed". Insist on seeing both, and treat any share-only narrative, internal or external, as unfinished analysis.
- Audit the construct behind any KPI that allocates capital. Read the raw items inside the composite: the actual queries, tickets, survey verbatims, or transactions. If nobody in the room can say what the metric is made of, its movements cannot be interpreted, only reacted to.
- Check whether the fast riser is actually taking from anyone. Growth narratives default to displacement. Test it: did the supposed victim's level fall, and do the two series co-move? Here the answer was no 29 times in 35, and "additive, not substitutive" changed the meaning of the entire chart.
- Distrust regional aggregates until member markets are shown to cohere. Three deliberately contrasting markets in one region matched three different comparator groups on another continent. The unit of analysis is the market, and regional strategy deserves the same construct audit as any other composite.
Notice what these four disciplines have in common. Each is a governance control on a decision input, not an analytical technique. They are the human version of what an agentic AI governance framework enforces on machines: know what fed the decision, know whether the reasoning holds, and be able to reconstruct both afterwards. A dashboard nobody has audited is an ungoverned decision input, whether the thing reading it is a person or an agent. That is the uncomfortable symmetry: as more decisions move to systems that act on these metrics without a human in the path of each action, an unaudited composite stops being a reporting problem and becomes an operational one.
The honest limits
Search data measures visible attention, never inner life; nothing here supports any claim that anyone thinks more or less about mortality because of AI, and the series' week-to-week movements are essentially uncorrelated, which is the plain statistical statement beneath any grander interpretation. Two anomalies remain open: a September 2025 AI surge concentrated in developing Asia, and an unexplained spike in late February 2026 that lifted the entire basket at once, across languages, for roughly 72 hours. The headline 2026 figures include that February; recomputed without it, no market's gap moves by more than 2.5 points and no ranking changes, so the findings do not depend on the anomaly. But something moved the connected world's attention toward its largest questions for three days, in unison, and it has not yet been named. That, too, is a familiar executive situation: the analysis is robust, and the most interesting question in it is still open.
Method notes: Google Trends returns a relative, sampled index of search interest, not absolute volumes, and reflects the Google-using world; it cannot see China and under-weights the smallest markets. The eight topics were pulled as Google Topics, aggregating across languages via Google's opaque per-language classifier. "Share" is a topic's fraction of the eight-topic total in a month; "level" is its index within its own market, the only quantity comparable over time. Every displacement verdict rests on levels; shares are never correlated. The co-movement figures are detrended (first-differenced) Pearson correlations between AI and the Death topic with February 2026 excluded: across the 35 markets they run from -0.16 to +0.46, median +0.05, with 34 of 35 inside |r| = 0.30. Of the six markets where the Death level fell, five sit at +0.16 or below (Timor-Leste, South Africa, Mexico, Vietnam, Myanmar), Nepal being the lone outlier at +0.27; the single strongest coupling in the whole panel, South Korea at +0.46, is a market where the Death level rose rather than fell, so even the tightest link in the data runs opposite to the displacement story. The baseline window is mid-2022 to end-2024, deliberately past the pandemic's opening; the incomplete final month is dropped; February 2026 is excluded from all detrended statistics, and the 2026 share figures were verified robust to its exclusion (maximum gap movement 2.5 points, no ranking changes). Crossover dates are windows, not single months. The composition audit classified each market's visible top and rising Death-topic queries, roughly 100 per market, and is bounded by that sample: it shows what leads the visible queries, not the full distribution. Thirty-five markets plus a worldwide series were analysed and validated against the platform's own reporting. Myanmar and Timor-Leste are thin-data series; conclusions were checked against the well-resolved markets. The triggers of the September 2025 and February 2026 anomalies remain unidentified.